
3 Key Methods To Eliminate Fake Tipsters
Never ever be fooled by fancy records dressed up by Fake Tipsters, we show you 3 simple methods & formulas To assess Tipster / Handicapper’s real ability.
Although I use the word fake tipsters, it is not necessarily cheating or fraud. What I refer to are the ones that mislead you to think good tipsters with or without intention despite the fact that the reality is not good.
This guide includes geek’s math / statistical science, and I know many are not interested in them. So skip all of them but just check what I highlighted in bold or red colour, or even only checking my Quick Wrap Up in bald brown colour could be enough.
The thing I would not like you to miss is the last Fake Tipster Conclusion section.
Tipster Survivorship Bias – Fake Tipsters Quick Check

Some bettors defer the betting selection process and use tipsters.
Unfortunately, it’s easy to confuse whether a tipster’s track record shows a statistically significant predictive ability or just a good run of luck.
This article explains how to judge a tipster using survivorship bias.
For example, there’s a tipster that, over five years, had a 100% track record of predicting tennis matches with an even probability of success – making a $50,000 profit.
Impressive, right? Not if you discovered that the star tipster was, in fact, a monkey.
Let’s say we run a simulation that sees 10,000 tennis tipsters (or monkeys, it really doesn’t matter) each with a 50% chance of either making $10,000 a year or losing $10,000 a year. If any tipster has a losing year, they are eliminated.
The tipsters/monkeys make their predictions by simply pushing one of two buttons. If we run the test for one year 5,000 of our tipsters would be $10,000 in profit and the same number $10,000 in the red and binned.
In year two we would have 2,500 monkeys with a perfect record and if we keep going by Year 5 we would have 313 monkeys from that original cohort that would statistically be able through pure luck to make successive accurate predictions and $50,000.
Confusing survivors with savants
This phenomenon is called survivorship bias, and it has huge significance in the real world of tipsters, because the successful tipster currently topping the tipster league table on hottips.com may just be a lucky monkey pushing a button.
What are the important factors that influence this process? The size of the original sample is critical.
If you just focus on the winners in this process, ignoring all the other billions of monkeys producing gibberish, you’re being fooled by randomness.
The simple fact is that by starting from a large enough sample, some of the participants will end up looking like a savant by pure luck.
On a very basic level, a good judge of a tipster would be whether they use Pinnacle.
The other critical factor is the probability of the event. Our example used a fair coin toss (50/50 chance of heads or tails), but in the real world, a bookmaker will hold an edge.
Re-running our test with higher margins produces fewer lucky winners: the lower the margin, the easier it is to achieve long-term success.
On a very basic level, a good judge of a tipster would be whether they use Pinnacle. Pinnacle odds are proven to be the best, so if they don’t use us, they clearly don’t know their stuff.
A clever illustration of survivorship bias

There are plenty of great examples of survivorship bias, but one particularly clever stunt by the famous English illusionist Derren Brown in a 2008 program called The System’ cleverly illustrated how deceiving it can be.
The show was based around the idea that a system could be developed to ‘guarantee a winner’ of horse races – a claim regular bettors will be accustomed to.
The show followed Khadisha, to whom Brown anonymously sent five correct horse race predictions in a row.
There was no trickery at work either, the predictions were fair and accurate and the program built towards a climax focusing on a sixth and final prediction where, confidence boosted by Brown’s 100% tipping record, Khadisha invested $4,000 of her own money… and lost.
Of course, there was no system; Khadisha was simply the product of survivorship bias.
Brown had actually started by contacting 7,776 people (sufficient sample size) and split them into six groups, giving each group a different horse from a six-horse race.
Note the number of variables is as equally important as the number of predictions in how quickly the original sample reduces in size.
A good judge of a tipster would be whether or not they use it.
After each race 5/6 of the people had lost and were dropped from the system (like our failing monkeys) and equal proportions of the survivors were randomly sent another selection. Khadisha happened to be the ultimate survivor, winning five times in a row.
The fundamental lesson for sports betting is that anyone can hit a lucky run, and the more improbable something is; the bigger role luck has.
If your typewriting monkey produces the Complete Works of Shakespeare from a sample of several billion, don’t get too excited. If he repeats the feat, however, take a closer look.
A simple formula to evaluate a tipster’s abilities
A simple way to evaluate a tipster’s true abilities is to take the square root of the total number of selections and add that number to one-half of the total plays made:
√ (No. Selections) + ½ (Total Plays Made)
For example, if he has 400 tips, the square root would be 20, which added to one-half of 400, gives a total of 220 theoretical wins.
If the tipster is 20 selections above 200, he is two standard deviations above average. There’s about a 1 in 40 chance of a 50% handicapper doing that.
So a player with 400 selections would need to go 220-180, or 60-40 with 100 selections to be this rare.
Without being a master statistician, you can quickly see that the more selections you can view, the easier it is to evaluate a player. In many cases, it’s safer to follow someone with a lower winning percentage if they have a lot more plays. Pinnacle Article
Quick Wrap Up
Firstly, don’t be fooled by the fancy presentation of Tipsters’ past performance, which may be distorted by Survivorship Bias. Use the very simple formula of
√ (No. Selections) + ½ (Total Plays Made)
to make a quick check. If the tipster’s winning is more than that, he/she can be pretty good. Besides, check if the tipster quotes Pinnacle price, which is based on the lowest margin thus the highest odds.
Such a price is fundamental for long-term success for punters. Whether using Pinnacle odds or not is another element to make a quick judgment.
BTW, you may want to read another survivorship bias article from Pinnacle, which gives you further insight into it.
Anyhow, you need to dig down further to gauge their real performance as follows;
2 Misleading Elements – Length of Records & Long or Short Odds To Identify Fake Tipsters
Betting tipsters often promise high strike rates that will win you a fortune. Although the promise of big profits is alluring, how can you tell the difference between a profitable tipster and a salesman? 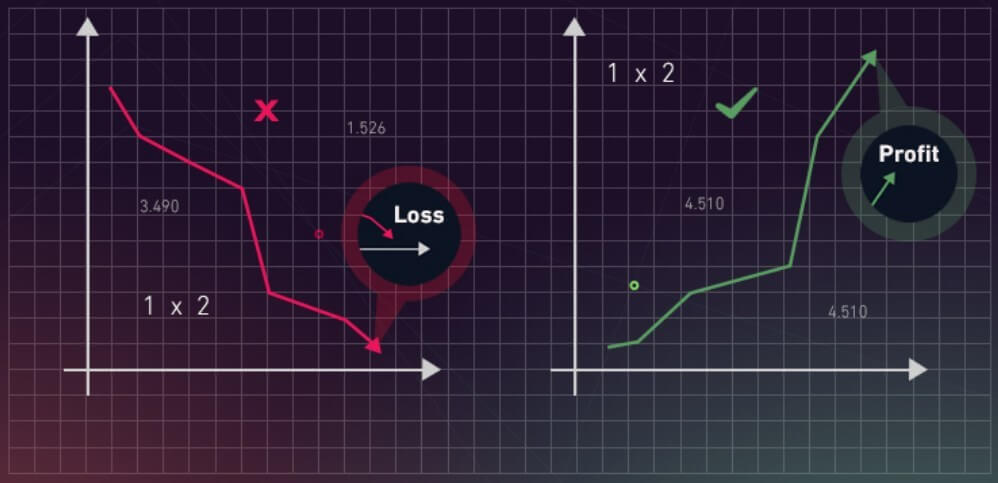
In a previous article, Mark Taylor explained how luck influences betting and whether profit is always a sign of skilful betting.
Using a series of coin tosses as an example, Mark used a binomial calculator to calculate the probability of making a profit after ten consecutive wagers.
The binomial distribution is well suited to 50-50 propositions like point spread or Asian handicap markets, where the odds for each side are close to even money, or a little shorter after the bookmaker applies his betting margin.
Often, however, bettors bet on all sorts of different prices with all sorts of different stakes, for example, 1X2 markets in soccer or match betting in tennis.

In such circumstances, we can rely on what is known as the t-distribution and the student’s t-test for statistical significance, which uses it. In this article, I explain how to use the t-distribution to gauge the performance of a betting tipster.
The length of a tipster’s record
The t-distribution is very similar to the bell-shaped normal distribution and for numbers of wagers above about 30, is to all intents and purposes the same thing. The t-test investigates the likelihood that a profit from a series of wagers could have happened by chance.
A return of 120% from 100 wagers at odds of 10.00 or longer is most likely to be a consequence of luck. Same returns from betting odds-on prices is an indication of skill.
The smaller the likelihood, the more probable it is that something else, like the bettor’s skill, is explaining their profitability.
The t-test simply compares the bettor’s observed return to a theoretical expectation (assuming chance only) defined by the market they’re betting in.
Usually, this would be a loss equivalent to the bookmaker’s margin or break even if the bettor is taking the trouble to find the best prices using an odds comparison tool.
The resulting t-score is then analyzed to determine whether the difference is statistically significant.
It should be intuitively obvious that the larger the profitability the bigger the t-score and the more statistically significant the betting history, in other words, the more likely it is that skill has played a part.
The t-score is directly proportional to a bettor’s excess average return over expectation.
Similarly, the longer the history (for an equivalent return) the more likely it is that something other than chance is at work. Consider, for example, two bettors with a 120% return on investment.
The first achieved it from 10 wagers, the second from 1,000. Who is more likely to be the skilled bettor?
If in doubt, think of tossing coins again. Landing six-plus heads out of 10 tosses is obviously far more likely than landing 600 plus from 1,000 assuming only chance.
Was one lands 600 or more heads, one might reasonably suspect the coin to be biased.
Similarly, we are more likely to conclude that a bettor with a long record of profitability is demonstrating skill. The t-score is in fact proportional to the square root of the number of wagers.
Long vs. short odds
Less intuitive is the influence of the betting odds. In fact, a 120% return on investment from betting odds around 1.25 will be a much better indicator of skill than equivalent profitability from betting odds around 5.00.
Betting on lower probability outcomes (longer odds) is inherently riskier (assuming equivalent stakes) because it is more at the mercy of random variability.
To put it another way, returns are more volatile. 19 or 21 winners at odds of 5.00 will give returns of 95% or 105% respectively.
In contrast, 79 or 81 winners at odds of 1.25 will show 98.75% or 101.25% profit over turnover. Betting longer odds implies taking more risks to get more rewards.
We can see the influence of the betting odds by means of the standard deviation in profits and losses of the betting history. For level staking, the standard deviation can be approximated by the following expression.
To approximate the standard deviation for level staking:

Where o represents the average odds for the betting history and r is the bettor’s actual return. The standard deviation in profits and losses betting at odds of 5.00 is more than four times larger than when betting at odds of 1.25.
Assuming that expected returns (based on luck only) are 100% (or break-even), the t-score is given by the following equation:

Where is the number of wagers? Consequently, the t-score for equivalent returns and length of betting history will be more than eight times smaller betting at odds of 5.00 compared to 1.25.
It should be clear that superior yields achieved through betting longer odds, as is typical in markets like horse racing, are not necessarily a sign of better forecasting talent.
The same amount of luck will deliver a much bigger percentage of returns.
Hence, comparisons of betting histories that consider only percentage returns, as is common when ranking tipsters, are fundamentally misleading.
By taking into consideration the betting odds, the t-score provides a measure of the quality of the risk-adjusted return in excess of expectation.
Calculating chance
The final step is to convert the t-score into a probability (the p-value) that a history of profitability could arise by chance only. Those with Microsoft Excel can make use of the TDIST function. This takes the form TDIST (t, degrees of freedom, tails), where t is the t-score whilst degrees of freedom is the number of independent pieces of data and is equivalent to the number of wagers minus one.
The tails argument can be either one (for the one-tailed t-test) or two (for the 2-tailed t-test). Since we’re really only interested in whether a profit is statistically significant, the former is preferred in this case. Alternatively, one can make use of an online calculator where these values can be inputted.
The table below shows some examples of t-scores and their corresponding p-values for betting histories of 100 wagers and a return on investment of 120%.
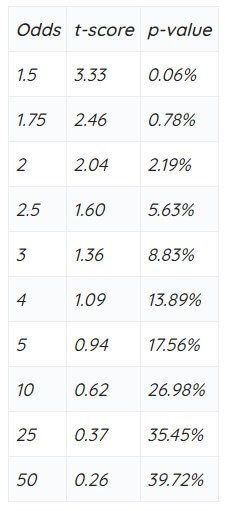
Evidently, the average odds at which someone bets have a big influence on whether their profitability can be considered lucky or skilful.
A return of 120% from 100 wagers at an odd of 10.00 or longer should clearly be considered largely a consequence of luck.
By contrast, if a bettor was to show the same return betting odds-on prices, it is far more likely that the profitability has arisen because of their skill.
Consequently, when comparing betting histories, for example from tipsters, it is not enough just to analyze their percentage returns, but also the length of their records and the odds at which they were achieved.
Pinnacle Article
Quick Wrap Up
Don’t be fooled by the fancy return % which even confirms not being affected by survivorship bias. The length of the tipping & the tactics (long or short odds) are the 2 key factors you need to check.
1 parameter, 120% return from 100 wagers at an odd of 10.00 or longer is Not Skill but largely Luck.
Then, finally, if we find very good tipsters who pass the above tests, is it enough? See the last check to verify whether he/she is “Too Good To Be True”.
2 Methods To Check Credibility – Closing Price & Randomness To Verify Fake Tipsters
For those of us who use tipsters to find positive expectations, there are two important questions. Is the tipster lucky or skilled? And is the track record genuine?
We have previously investigated how to evaluate a tipster’s ability and how to test a betting record for evidence of predictive skill over luck. Now we look at how you can assess a record’s credibility. Read on to find out.
Pinnacle has previously investigated how to evaluate a tipster’s ability (the 1st article) and how to test a betting record for evidence of predictive skill over luck (the 2nd article).
But once you have your hands on a tipster’s seemingly credible record, how do you know that it is still a good deal for you to invest your money in? Let’s find out.
The t-test revisited
Previously, I’ve discussed how the t-test can help look for evidence of forecasting skills, by investigating the likelihood that a profit from a series of wagers could have happened by chance.
The smaller that probability the greater the likelihood that something else, like skill, might have caused it. However, when a betting record looks too good to be true, we might arrive at a different conclusion: a manipulated record.
Consider the history of an online soccer tipster specializing in over/under and match odds markets, offering customers “quality tips, great odds, and BIG winnings.”
Between August 2013 and October 2014, prior to submitting his picks to a well-known tipster surveillance service (since discontinued due to allegations of misconduct), there were 296 of them, with an average win expectation of 50% and average odds of 2.04. 220 of them were winners, for a strike rate of 74% and a return on investment of 151%. The profit chart looks like this:
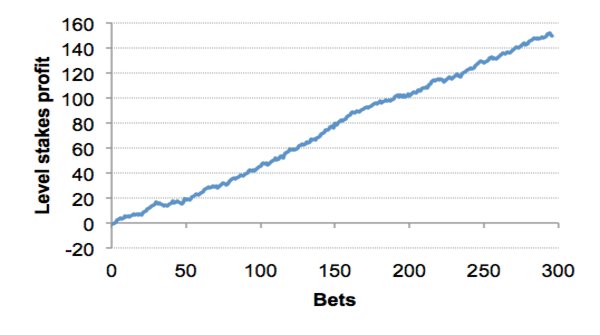 With a t-score of 9.3, such a record of profitability could be expected to happen by chance roughly once in a million trillion times.
The improbability of such an event and the near-perfect profit trend that verges on the impossible should set alarm bells ringing.
Nevertheless, such a result does not prove that the tipster is cheating. He could yet be the most supremely talented forecaster. How, then, can we test that proposition?
Method 1: Study the closing prices
Mirio Mella has previously talked about the significance of the market movement. Prices adjust as bettors express their opinions with money, reflecting the available news about teams or players.
The greater the interest in a particular team or player is, the greater the likelihood that their odds will shorten. Dafni Serdari also explains why the closing price is important.
“The odds offered just before a game begins are called the closing line and reflect all statistics, news, wagering activities and market sentiment.
The closing line should be the most efficient point of the market, and therefore the most accurate representation of underlying probability.”
Bettors who consistently beat the closing price are considered to be sharp. They have brought information to the market, which is reflected in their ability to shorten the odds.
Where they consistently beat the closing price by more than the margin, this is a sign of positive expectation and helps distinguish winning from losing players, or sharps from squares.
I’ve previously analyzed a large sample of opening and closing prices. This unequivocally demonstrates that the margin by which you beat the closing price is an excellent predictor of your profit expectation.
For example, if you bet a price of 2.20 on a team that closes at 2.00, your predicted advantage will be 10% (minus the margin).
Does our “quality tipster” consistently beat the closing price? With a profit expectation of 51% we should expect to see odds of 2.00 shorten by 51% plus the margin to about 1.30.
Inspecting the tipster’s final 20 tips advised with Pinnacle in the study sample we find the following.
- 8 prices shorten (average 6.7%, largest 19.5%)
- 7 prices lengthen (average (3.5%, largest 7.1%)
- 5 stay the same
- The average movement was a 1.5% shortening
- The typical margin is 2%
There is no statistically significant difference between this and randomness. This tipster is not moving Pinnacle’s market in any systematic manner.
Indeed, he’s not even covering the margin. Evidently, when he was advising his tips, Pinnacle was not taking notice.
Method 2: The Wald–Wolfowitz runs test for randomness
A second method we can use to test the credibility of a tipster’s betting history is the Wald–Wolfowitz runs test for randomness.
Named after Abraham Wald (the statistician who discovered survivorship bias) and Jacob Wolfowitz, this test determines whether a binary data sequence arises from a random process.
Regardless of any signal arising from the tipster’s skill, sequences of wins and losses should still reflect the underlying random noise in the history, since each sequential bet is independent of the previous.
A tipster advising even-money propositions with no forecasting skill would replicate a series of coin tosses. A tipster with a 74% strike rate would represent a weighted coin 74:26 in favour of heads over tails.
We’ll see three times as many heads as tails, but the sequence distribution will still be random.
Consider the following sequence of wins and losses:
W W L L W L W W W W L W W L L L L L W W
There are 11 wins, 9 losses, and 9 observed runs (Ro), where a run is defined as a series of consecutive wins or losses (including only one win or loss).
Determining whether this sequence is random or otherwise, requires us to calculate the expected number of runs from 11 wins and 9 losses and compare this to the number observed.
The bigger the difference, the less likely it is that the sequence is random. Under the (null) hypothesis that the sequence is random, the expected number of runs (Re) is given by:
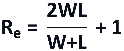
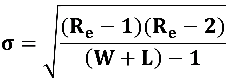
Where W and L are the numbers of wins and losses respectively. The distribution of possible runs is approximately normal with standard deviation (σ), given by:
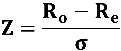
We then calculate the test statistic (Z), defined by:
Finally, we convert this into a probability (the p-value) that the difference between the observed and expected number of runs could have arisen by chance.
In Excel, this can be performed using the NORMSDIST function, as I have done with my own run test calculator.
The smaller the p-value, the greater the likelihood that the hypothesis of randomness and statistical independence of the win-loss sequence may be rejected. Typically this happens at p-value = 5% (Z = 1.96) or sometimes 1% (Z = 2.58).
For the sequence above Re = 10.9, Z = 0.88 and the p-value = 38%, from which we would conclude that the sequence is random.
A successful runs test rests on the assumption that the probability of each bet outcome is the same (as for a coin toss). Although this is typically not the case where odds for tips vary, it should not be violated excessively where they are broadly similar.
This will most commonly be true for Asian handicappers and point spreaders where odds show a narrow range of around 2.00.
For our tipster under analysis, 96% of his tips had win probabilities of between 40% and 60% with 78% between 45% and 55%. So what does a run test say about his record?
- Number of tips (n) = 296
- Winners (W) = 220
- Losers (L) = 76
- Observed runs (Ro) = 135
- Expected runs (Re) = 114
- Z = 3.21
- P-value = 0.1%
From these results, we can confidently reject the hypothesis that the sequence is random. There are simply too many runs compared to expectation for a tipster with a 74% strike rate with average odds close to 2.00.
A closer inspection reveals why the randomness test failed: an excess of shorter runs and a dearth of longer ones.
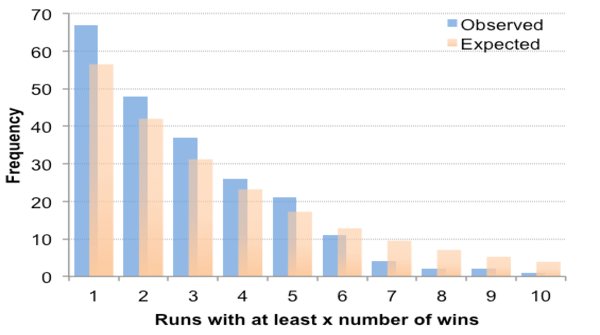
The expected number of runs containing at least x wins is approximated by nqpx where p = win expectation (74%) and q = 1 – p (26%).
For example, there were 67 runs with at least 2 consecutive winners compared to an expectation of 56. By contrast, there were just 2 runs of at least 8 consecutive winners when the expectation was 7.
Fooled by randomness
If this tip’s history is not random, what is it?
The simplest explanation is that it has been manipulated. Given the excessive number of shorter winning runs, the likelihood is that the tipster has too often inserted a losing result to break up a longer winning sequence. Why?
We suffer a cognitive bias known as the clustering illusion, with a tendency to erroneously consider inevitable runs or clusters arising in random distributions to be meaningful.
Consequently, when asked to actually create random binary sequences the majority will switch from W to L or vice versa if they feel that one of them is happening too often.
Our tipster has evidently perceived long winning runs to look unnatural when the opposite is true. In fact in a sequence of 296 tips with a win expectation of 74%, we should typically see at least one run of 15 wins. His largest was 11 with one other of 9 and two of 7.
Too good to be true?
If a tipster’s record looks too good to be true, it probably is. Before buying, test it for evidence of outperforming the closing odds and the presence of randomness in its sequences.
If neither exists, keep your money in your wallet and move on.
With regards to this “quality tipster”, another analysis of closing prices for his most recent tips shows he’s still not influencing Pinnacle’s market at all.
Furthermore, he’s now been shown to be altering past tip histories, inserting a series of losing tips presumably with a view to making the record look less impossible.
A re-run of the Wald–Wolfowitz runs test will be able to determine if he’s still fooled by randomness. If he is, make sure you are not.
Pinnacle ArticleQuick Wrap Up
Don’t be fooled by the excellent record that looks like “Too Good To Be”. Constantly beating the closing price (especially Pinnacle one) is 1 evidence to be genuine.
But, what about manipulation? If you have time & knowledge to run the above test for randomness, it’s worth doing. Well, if you don’t, see the below Conclusion;
Fake Tipster Conclusion
Summary
Summarizing all points in this document, in order to verify the tipster ability;
- Firstly, quickly see if the tipster’s record is affected by survivorship bias with the formula of; √ (No. Selections) + ½ (Total Plays Made). And also see if Pinnacle odds is used as their quoting price. If it clears survivorship bias and uses Pinnacle, looks worth checking further.
- Second, check the Length of the Tipping Record and Odds Tactics (Long or Short). In the article, there is no specific indication of the length, but I personally feel at least 2 years & a few hundred tips look minimum as the base sample to prove any numbers. For Long or Short, again there is no definite parameter to judge. But the key point is if the good record comes from long-odds tactics, you need to be careful. Because it could be the result of luck rather than skill. In other words, if it comes from short odds tactics, it’s safer to go ahead.
- Finally, the credibility of the records. Honestly speaking, the majority of punters don’t have time to run such complicated tests as specified in the article. In the first place, I position this element as the last based on the Pinnacle article’s original sequence though, it could be the first point you can check. Because manipulation of the record can be avoided by the 3rd Party Proofing System or Verified By the Public if the tips are announced in a public place. So, as long as you chose the tipsters whose tips are proven, you can largely avoid this “Too Good To Be True” issue.
2 Reliable Tipster Rating Service & Betting System
Taking all the above points into account, we think the following 2 tipsters/handicapper-related systems are worth considering to save your research time;
SBC (Smart Betting Club) – For The Players in UK & Europe
SBC is not a tipster but a tipster proofing & rating service. Their priority area is UK & European sports and probably the most reputable rating service supported by a frequent quotes by media in this industry. Please take a look at our Smart Betting Club Review – Inside Analysis Of Ultimate Sports Betting Method
- Obviously, you don’t need to worry about “Too Good To Be True” because they prove all the tips.
- Their Hall Of Fame Tipsters (top 20+ tipsters) are the results of SBC’s over decade’s proofing & rating work, of which rating criteria are very strict. Therefore, their top-rated tipsters have large chances to continuously provide profit for the long term in the future.
ZCode System – For The Players Anywhere In The World
ZCode System is probably one of the most successful sports investing systems in the world.
Their priority area is US’s 4 Major sports (also cover soccer & horse racing) but being used by punters worldwide.
ZCode system comprises Computer Automated Tips based on huge database & Human Expert Tips. Please take a look at; ZCode Review – Full Inside Analysis / Founder Interview / Secret Of Winners Worldwide
- All of their tips are publicized on the private site & forum, thus being verified by thousands of members. This means, no need to be bothered by the credibility of their record.
- Actually, their records are verified publicly all the way back to 1999 by back-testing and also forward testing, of which significantly large databases prove authentic & reliable enough.
- The tips are produced based on the analysis of over 800 parameters and their rating on all different strategies enables the members to choose the best-fit tactics from 120+ available systems.
- All of their quoting prices are Pinnacle, which gives a good base for better profit in long term.
The trusted system demands a trusted bookmaker.
Zcode strongly recommends Pinnacle. Pinnacle is the Best of The Best Sportsbook in the world for Professional Punters. Suggest you take a look at Pinnacle Full Review – Is Pinnacle Bet Really Perfect Sportsbook for Sharp Punters?, and the relevant report of Pinnacle Arbitrage – Alternative to Laying on Exchanges.
For those who are not able to access Pinnacle due to the country restriction, consider Bet Broker, see Honest Opinion About Bet Broker & How To Use Them Safely & Smartly.
There are many Sharp punters who make a living from sports betting with the combination of Pinnacle & the 2 betting systems I listed above.
You may ask is it really possible to live off sports betting? See the report we examined our 3 advantage plays in ‘How To Make Living Sports Betting
Lastly, allow me to quickly share our principle.
Even if we do bet, we Don’t Gamble, which means we don’t rely on luck or chance. We do 6 Advantage based on Mathematical Edge to Beat online bookies, casinos & bingo.
When it comes to Sports Betting, we use Matched Betting & Sports Arbitrage for starters. So if you started betting but have not done these 2 advantage plays, suggest clicking those links to take a look first because you can lock in profit without risk easily.
Our last advantage play for sports is Value Bet On Proven Tipster.
Yes, that’s the subject of this document. There are so many self-declared fake tipsters on the internet.
As you may be aware, tipping performance can be distorted or disguised to look fantastic even if the fact is very poor.
Thus, knowing how to gauge the performance & eliminate fake tipsters to reach the genuine best is critically important.
That’s the reason why we show you 3 Easy but Effective ways to Distinguish Between Fake Tipsters & Real Skilled Tipsters.
Hope this will help you make no mistake to chose a disappointing tipster.
Good Luck!!
Joshua Walker (bio)
Editor – Global Extra Money (GEM)